Graphs and Charts
Graphs and Charts
Besides grouping, another method for organizing and summarizing data is to draw a picture of some kind. The old saying "a picture is worth a thousand words" has particular relevance in statistics -- a graph or chart of a data set often provides the simplest and most efficient display.
Histograms, dotplots, and stem- and- leaf diagrams are designed for use with quantitative data.
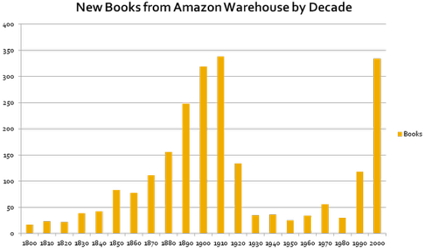
Frequency Histograms
A graph that displays the classes on the horizontal axis and the frequencies of the classes on the vertical axis. The frequency of each class is represented by a vertical bar whose height is equal to the frequency of the class.
Relative-Frequency Histogram
A graph that displays the classes on the horizontal axis and the relative frequencies on the classes on the vertical axis. The relative frequency of each class is represented by a vertical bar whose height is equal to the relative frequency of the class.
Relative- frequency histograms are better than frequency histograms for comparing two data sets. The same vertical scale is used for all relative-frequency histograms -- a minimum of 0 and a maximum of 1 -- making direct comparison easy. In contrast, the vertical scale of a frequency histogram depends on the number of observations, making comparison more difficult.
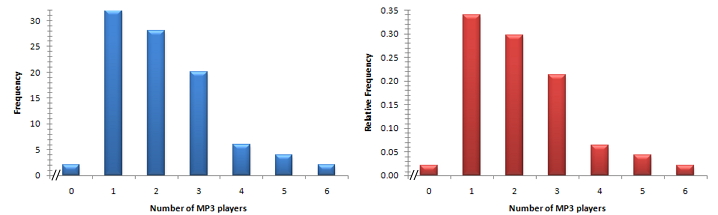
Example of a frequency histogram and a relative-frequency histogram
Another type of graphical display for quantitative data is the dotplot. Dotplots are particularly useful for showing the relative positions of the data in a data set or for comparing two or more data sets.
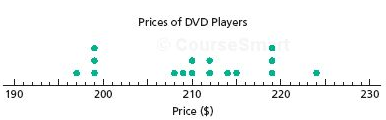
Example of a dotplot diagram
Statisticians continue to invent ways to display data. One method, developed in the 1960s by the late Professor John Tukey of Princeton University, is called a stem- and- leaf diagram. This ingenious diagram is often easier to construct than either a frequency distribution or a histogram and generally displays more information.
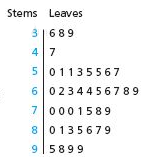
Example of a stem-and- leaf diagram.
Steps to construct a Stem-and-Leaf Diagram
- Think of each observation as a stem, consisting of all but the rightmost digit, and a leaf, the rightmost digit.
- Write the stems from smallest to largest in a vertical column to the left of a vertical rule
- Write each leaf to the right of the vertical rule in the row that contains the appropriate stem.
- Arrange the leaves in each row in ascending order.
We use different techniques for qualitative data: two common methods are the pie chart and the bar graph.
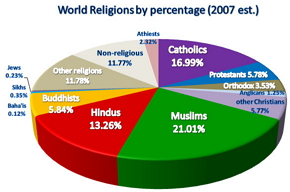
Example of a pie graph
Example of a bar graph
A bar graph is like a histogram. However, to avoid confusing bar graphs and histograms, the bars in a bar graph are positioned so that they do not touch each other.