Asymptotes and Graphing Rational Functions
To graph a rational function, find the asymptotes and intercepts, plot a few points on each side of each vertical asymptote and then sketch the graph.
Finding Asymptotes
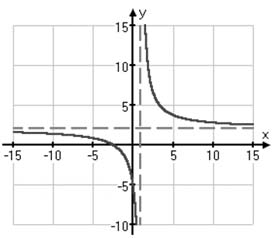
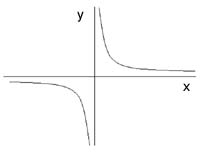
Vertical asymptotes are "holes" in the graph where the function cannot have a value. They stand for places where the x-value is not allowed. Specifically, the denominator of a rational function cannot be equal to zero. Any value of x that would make the denominator equal to zero is a vertical asymptote.
It is common practice to draw a dotted line through any vertical asymptote values to denote that the function cannot exist in those places. The vertical asymptotes inform the domain of the graph. Specifically, the domain of the graph will be any allowable numbers other than those that create a zero in the denominator – i.e., the vertical asymptotes are excluded from the domain.
Horizontal and Slant Asymptotes
A horizontal or slant asymptote shows us which direction the graph will tend toward as its x-values increase. Unlike the vertical asymptote, it is permissible for the graph to touch or cross a horizontal or slant asymptote.
To find the horizontal or slant asymptote, compare the degrees of the numerator and denominator.
Horizontal Asymptote
If the degree of x in the denominator is larger than the degree of x in the numerator, then the denominator, being "stronger", pulls the fraction down to the x-axis when x gets big. That is, if the polynomial in the denominator has a bigger leading exponent than the polynomial in the numerator, then the graph trails along the x-axis at the far right and the far left of the graph. The x-axis becomes the horizontal asymptote.
When the degrees of the numerator and the denominator are the same, then the horizontal asymptote is found by dividing the leading terms, so the asymptote is given by:
y = (numerator's leading coefficient) ÷ (denominator's leading coefficient)
The horizontal asymptote may also be approximated by inputting very large positive or negative values of x.
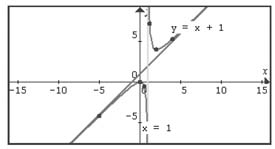
Slant Asymptote
If the numerator is one degree greater than the denominator, the graph has a slant asymptote. Using polynomial division, divide the numerator by the denominator to determine the line of the slant asymptote.
Finding Intercepts
To find x- or y-intercepts, set the other variable equal to zero and solve in turn.
Plotting Points
Based on information gained at this point, select x-values and determine y-values to create a chart of points to plot. Select more plots in areas where you think you need information to inform your curve.
Sketching the Graph
Once the points are plotted, remember that rational functions curve toward the asymptotes. Include additional points to help determine any areas of uncertainty. In addition, graphing calculators are often used in conjunction with sketches to define the graph.
Example
Graph:
1. Find the vertical asymptotes.
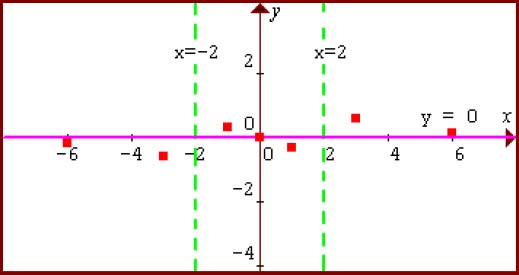
Factor the denominator: (x + 2)(x − 2) and set equal to zero. If (x + 2)(x − 2) = 0, then x cannot be 2 or -2. Therefore, the vertical asymptotes are located at x = 2 and x = -2. Sketch these as dotted lines on the graph.
2. Find the horizontal or slant asymptotes.
Since the degree of the numerator is 1 and the degree of the denominator is 2, y = 0 is the horizontal asymptote. There is no slant asymptote. Sketch this on the graph.
3. Find the intercepts.
Set x = 0; y = = 0.
Set y = 0; 0 = implies that x = 0.
Therefore, there is only one intercept: (0, 0)
4. Plot points on either side of the asymptotes.
Select values for x and determine values of y. Plot the results.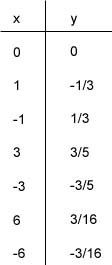
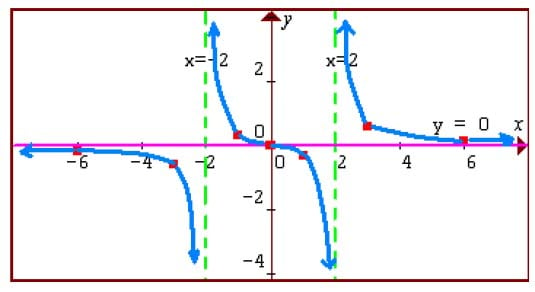
5. Sketch the graph.
Consider that the graph must "take off" near the vertical asymptotes and "level off" near the horizontal asymptote. Sketch with appropriate curves.
Practice
Follow the steps to graph each rational function:
2. Find any horizontal/slant asymptotes.
3. Find intercepts.
4. Plot points.
5. Sketch the graph.
1)
2)
3)
Answers
1) 
2) 
3)