Graphing Linear Equations
Graphing Linear Equations in Two Variables
A linear equation in two variables is an equation that can be written in the standard form
ax + by = c
where a, b, and c are real numbers
The graphs of the equations ax + by = c are straight lines. This is why the equations are called "linear."
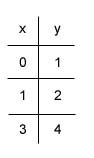
A solution to a linear equation in two variables may be an ordered pair, (x, y). There may in fact be multiple or infinite possible solutions to a linear equation. For example, y = x + 1 has infinite solutions-- (2, 3), (3, 4), (7, 8), to name a few. Since it is not possible to list all the solutions, we instead illustrate them with a graph.
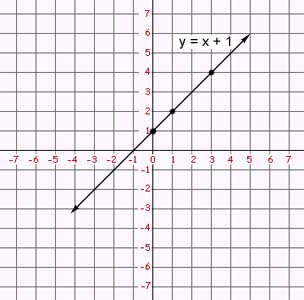
To graph an equation, you will need to determine ordered pairs that satisfy the equation and plot the points. It is often helpful to plot at least three points. To determine what points satisfy the equation, you may plug in a number for x and determine the necessary output for y. You may want to rewrite the equation in the form y = ___ in order to determine the y output more easily. As a final step, draw a line that connects and extends from the three points.
Example
Graph the line of y = x + 1