Graphing Exponential Functions
Graphing Exponential Functions
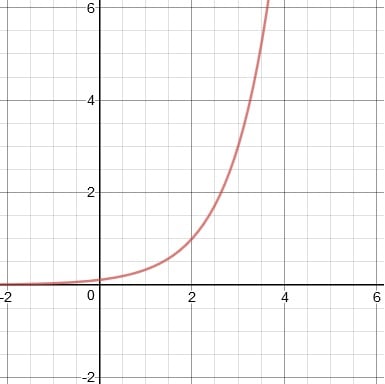
It is important to know the general nature and shape of exponential graphs. The actual values that may be plotted are relatively few, and an understanding of the general shape of a graph of growth or decay can help fill in the gaps.
Exponential Growth
An exponential growth function can be written in the form y = abx where a > 0 and b > 1. The graph will curve upward, as shown in the example of f(x) = 2x below.
| x | f(x) = 2x |
| −3 | 2−3 = 1/8 |
| −2 | 2−2 = 1/4 |
| −1 | 2−1 = 1/2 |
| 0 | 20 = 1 |
| 1 | 21 = 2 |
| 2 | 22 = 4 |
| 3 | 23 = 8 |
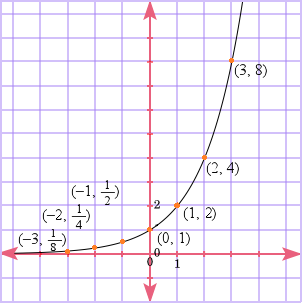
Notice that as x approaches negative infinity, the numbers become increasingly small. That is because a negative exponent translates into increasingly small fractional numbers. y = 0 is a horizontal asymptote, toward which the graph tends as the x-axis continues to the left.
Also note that the graph shoots upward rapidly as x increases. This is because of the doubling behavior of the exponential.
Exponential Decay
In the form y = abx, if b is a number between 0 and 1, the function represents exponential decay. The basic shape of an exponential decay function is shown below in the example of f(x) = 2−x. (This function can also be expressed as f(x) = (1/2)x.)
| x | f(x) = 2−x |
| −3 | 2−(−3) = 8 |
| −2 | 2−(−2) = 4 |
| −1 | 2−(−1) = 2 |
| 0 | 20 = 1 |
| 1 | 2−1 = 1/2 |
| 2 | 2−2 = 1/4 |
| 3 | 2−3 = 1/8 |
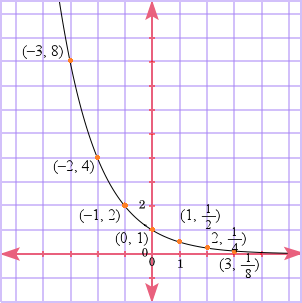
Again, this graph has the line y = 0 as an asymptote.
Variations on the General Graph
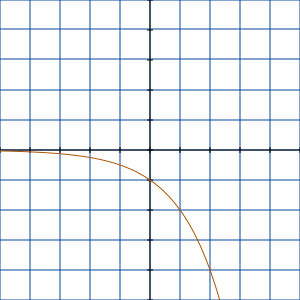
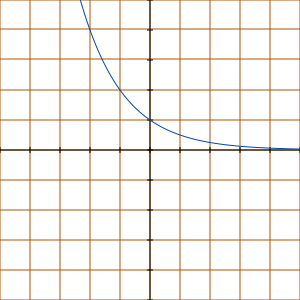
Note that if b is negative, the curve will curve downward as the x values increase. Note that if the exponent is negative, the curve will tend upward in the negative x values.
Consider these basic forms for y = −2x and y = 2−x respectively.
| y = −2x | y = 2−x |
 |  |
y = abx − h + k
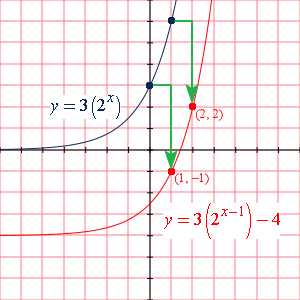
begin by sketching the graph of y = abx and then translate the graph horizontally by h units and vertically by k units.
Example
Graph 3(2x−1) − 4
Solution
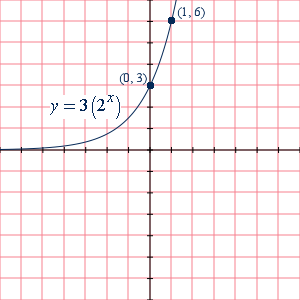
First lets sketch y = 3(2x ) and notice that it passes through (0, 3) and (1, 6)
Try it yourself
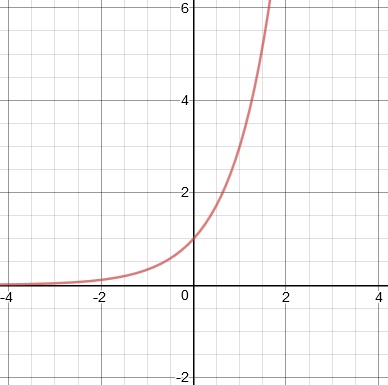
1. Graph y = 3x
2. Graph y = −(3/2)x
3. Graph y = 2 × 5x
4. Graph y = −2 ÷ 5x
5. Graph y = 3x − 2
Answers
1.
2.
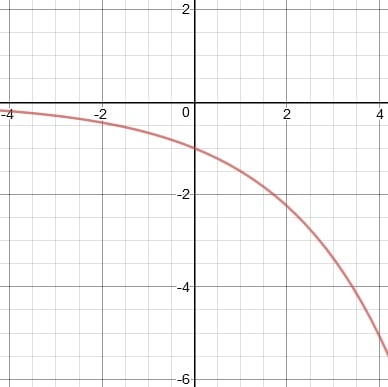
3.
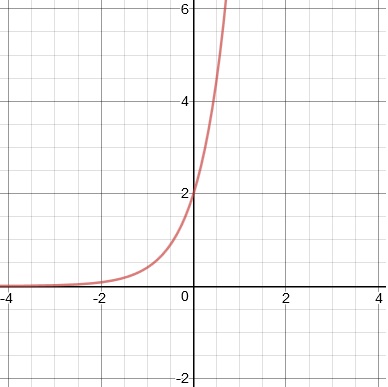
4.
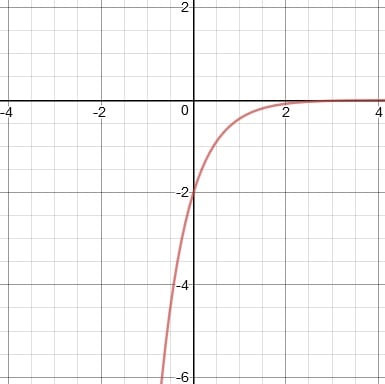
5.
