 Learning Target: I create and read information from a bar graph. Learning Target: I create and read information from a bar graph.
Read and Make a Bar Graph
Example
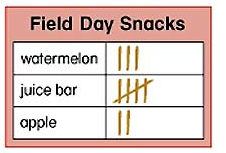 The tally chart shows how many children choose each snack on Field Day.
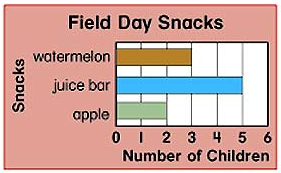 The bar graph shows the same data.
To read the bar graph, find the end of the bar. Then look at the number below the end of the bar.
Let's Practice Together
Use the bar graph above to answer the questions.
1. How many children chose watermelon?
2. Which snack was the least popular?
3. How many more children picked the juice bar than the apple?
Your Turn
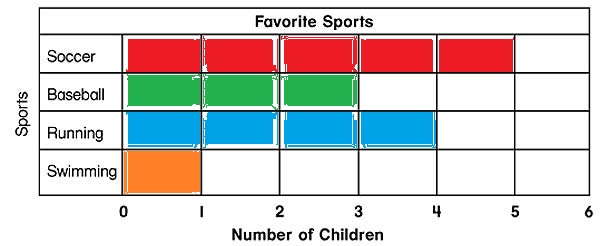
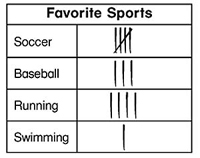 Andrew asked his classmates to choose their favorite sport. Look at his tally chart.
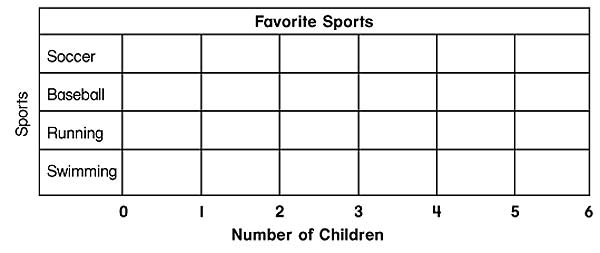
 4. Use Andrew's tally chart to make a bar graph below. Color 1 box for each tally mark.
Use the bar graph to answer each question.
5. How many children chose running?
6. Which sport did the greatest number of children choose?
7. How many more children chose baseball than swimming?
Check for Understanding
1. Which do you think is better for comparing the number of votes, the tally chart or the bar graph? Why?
Answers
1. 3
2. apple
3. 3
4.
5. 4
6. soccer
7. 2
Check for Understanding
1. bar graph; the differences are more noticeable