More Fun with Functions!
Odd vs. Even
Like with whole numbers, functions can be odd or even (unlike with numbers, though, a lot of functions are neither).
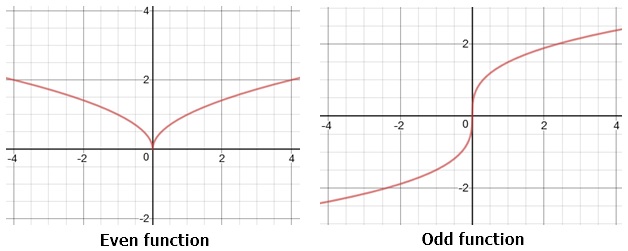
With some functions, you can replace x with −x and not change the result. For example, consider f(x) = x2. If x = 5, then f(5) = 52 = 25. But if x = −5, then f(−5) = (−5)2 = 25 as well. Because f(x) = f(−x), we say this function is even.
With other functions, if you replace x with −x, the result will be the opposite of what it was before. Consider f(x) = x3. If x = 2, f(2) = 23 = 8. But if x = −2, then f(−2) = (−2)3 = −8. Because f(x) = −f(−x), we say this function is odd.
Even function: f(x) = f(−x)
Odd function: f(x) = −f(−x)
Transformations
You can find the pattern for some functions easily by taking the graph of a basic function and transforming it. There are a number of different transformations you can perform on a function that affect its graph in different ways.
For example, the graph of y = 2x is shown below:
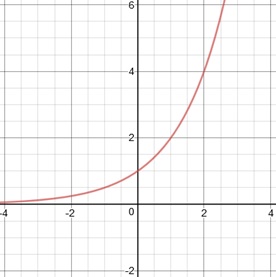
You can translate this graph by moving it up, down, or sideways. By adding or subtracting a number to the function itself, you can move a graph vertically that number of units:
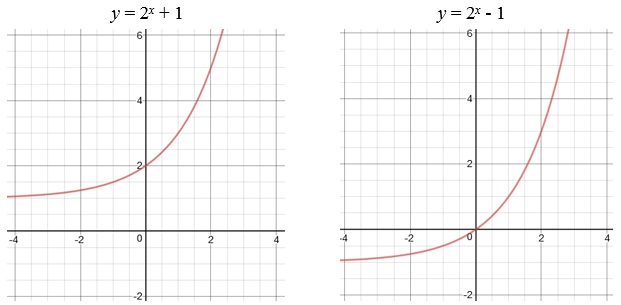
When we added 1 to the function, the whole graph moved upward by 1 unit, and subtracting a number from the function made the graph move downward.
To move a graph sideways, add or subtract a number to the variable:
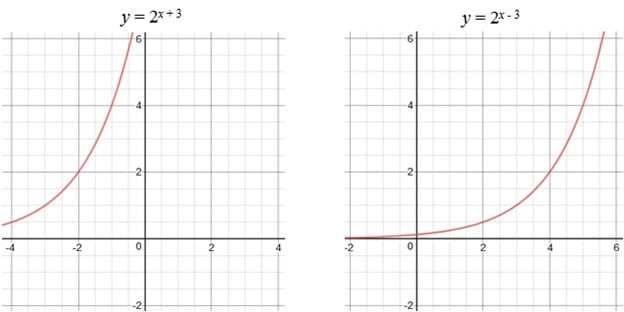
Notice how the graph moved to the left when we added a number to the variable, and moved to the right when we subtracted it. That might not be what you’d expect.
In addition to moving a graph around, you can also "stretch" or "compress" it. These transformations are called dilations, and you perform them by multiplying a function or its variable by a constant:
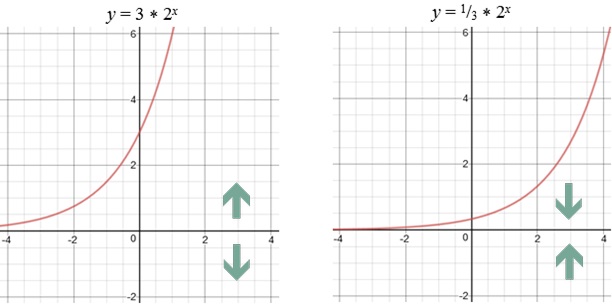
Multiplying a function by a constant greater than 1 makes the graph stretch vertically, and multiplying by a constant between 0 and 1 makes the graph compress vertically. In these cases, we have a vertical stretch by a factor of 3, and a vertical compression by a factor of .
When you multiply the variable by a constant, the dilations happen horizontally, but with the opposite relationship:
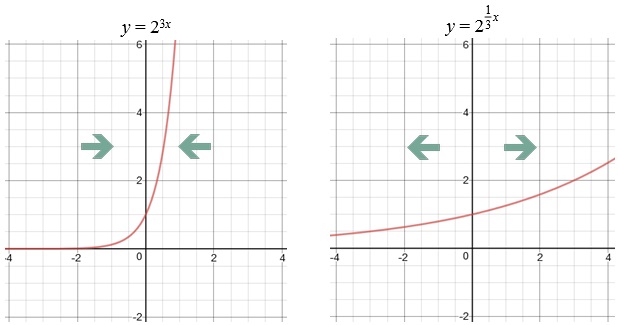
On the left, we see horizontal compression by a factor of (not 3), while the graph on the right went through a horizontal stretch by a factor of 3 (not ).
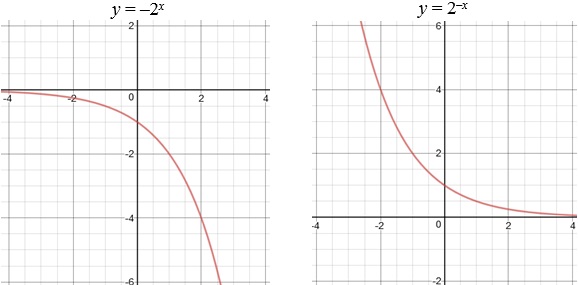
Finally, you can reflect a graph over either one of the axes. Multiply the entire function by -1 to see a reflection over the x-axis, and multiply the variable by −1 to see a reflection over the y-axis:
Practice
Determine whether each function is odd, even, or neither.
1. f(x) =
2. f(x) = x2 + 1
3. f(x) = |x|
Let $x$ be a function of x. Describe how the graph of y = $x$ would be affected by the following transformations:
4. y = $x$ − 5
5. y = 2$x$
6. y = $(x + 2)$ + 4
7. y = $x$
8. y = $(−x)$ − 1
9. y = $(7x − 9)$
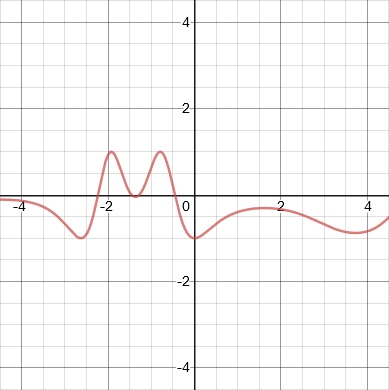
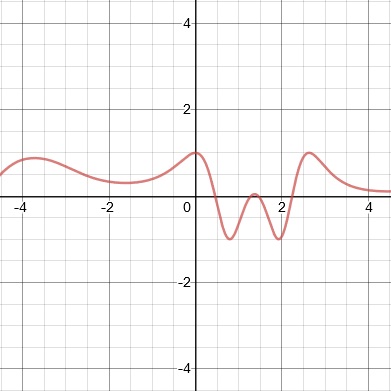
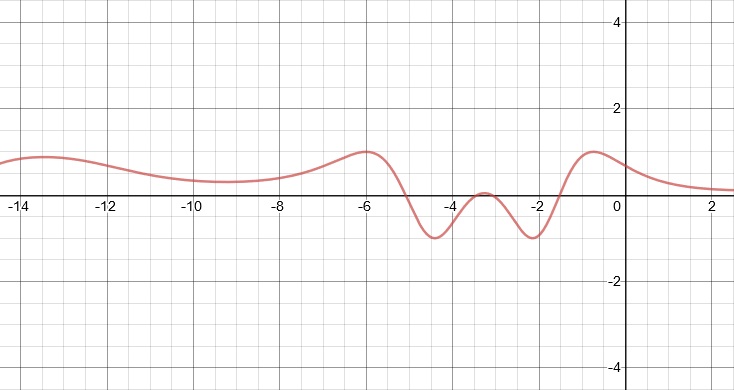
Below is the graph of y = #x#. Use it to sketch the graph of the following functions.
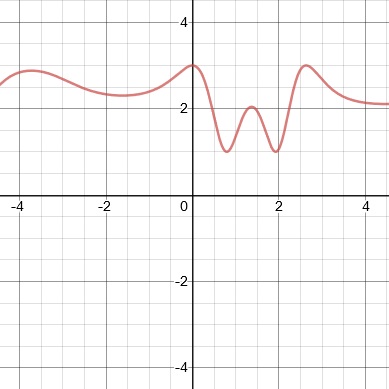
10. y = #x# + 2
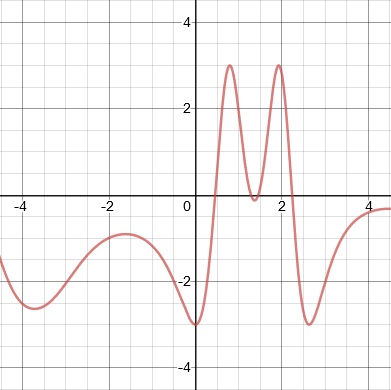
11. y = −3#x#
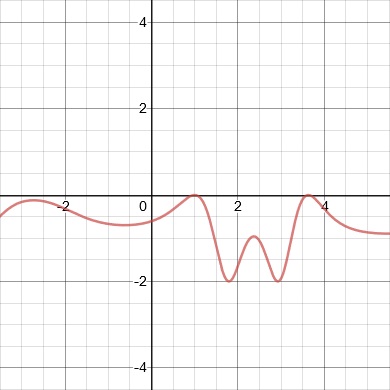
12. y = #(x − 1)# − 1
13. y = #(x + 3)#
14. y = − #(−x)#
Answers
1. odd
2. even
3. even
4. translation 5 units downward
5. vertical stretch by a factor of 2
6. translation 2 units to the left and 4 units upward
7. reflection on the x-axis and a vertical compression by a factor of
8. reflection on the y-axis and a translation of 1 unit downward
9. translation 9 units to the right and a horizontal compression by a factor of 7 (in that order)
10.
11.
12.
13.
14.